[TSVN] Statistics graphs
Date: 2005-05-01 22:00:34 CEST
Hi Stefan,
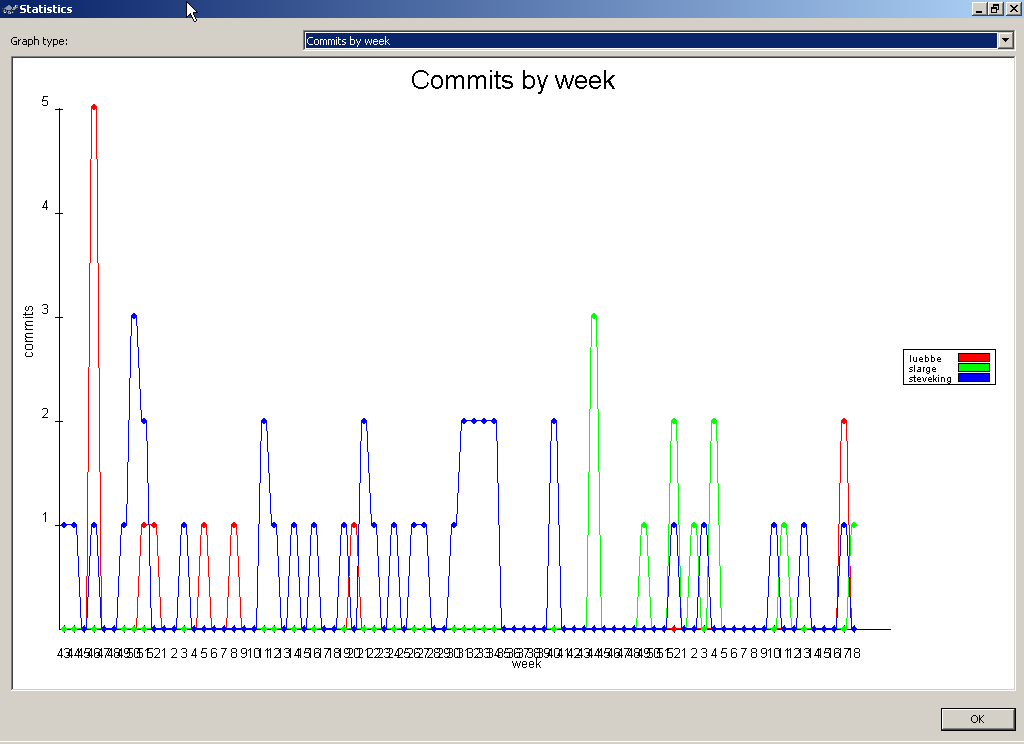
Now that the revision log dialog gets 100 messages rather than 100
revisions, we often have some much longer time spans in the graphs. The
attached graph is from TSVN doc/images and covers 37 weeks. As you can
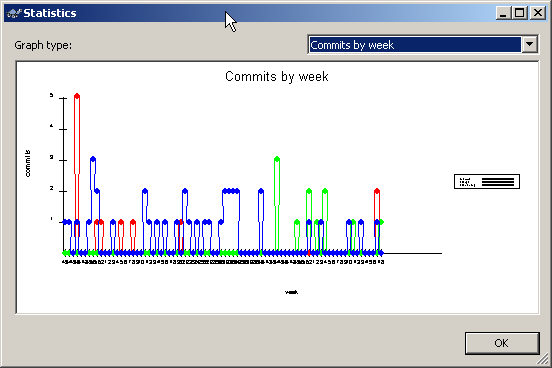
see, the week numbering is unreadable, even when maximised, and in
stats2.png the graph is bending in and out to make the curve fit around
the points.
Can I suggest that if there are a lot of weeks that you combine points
in the graph, so you get maybe every 2 weeks, 3 weeks or whatever.
Even if you don't do this, the axis labelling should have less points.
Simon
--
       ___
  oo  // \\      "De Chelonian Mobile"
 (_,\/ \_/ \     TortoiseSVN
   \ \_/_\_/>    The coolest Interface to (Sub)Version Control
   /_/   \_\     http://tortoisesvn.tigris.org
---------------------------------------------------------------------
To unsubscribe, e-mail: dev-unsubscribe@tortoisesvn.tigris.org
For additional commands, e-mail: dev-help@tortoisesvn.tigris.org